
Wimmera CMA Soil Moisture Probe Network
Wimmera CMA is encouraging Yarriambiack farmers to access the Wimmera CMA Soil Moisture Probe Portal.
The portal is made up of a network of weather stations, collecting a range of data, such as soil moisture, air temperature, Delta T, humidity, wind speed and direction, rainfall and harvest fire danger index.
The region wide installation of weather stations across 30,000 square kilometres was delivered through funding from the Australian Government’s Future Drought Fund. Close to 20 of these weather stations have been installed within the Yarriambiack region.
Soil moisture probes are installed into the soil profile and connected to a telemetry unit (weather station). Data from the soil moisture probes and weather stations is received in 15-minute intervals and can be accessed in real time on the Wimmera CMA soil moisture platform.
Farming is an expensive and high-risk enterprise. Accurate data from the soil moisture probe network can be combined with climate forecasts and yield calculators to inform and assist with decision-making that greatly reduces exposure to risk. For example, farmers can use soil moisture data to help inform crop selection for sowing, how much fertilizer to apply and when, or later in the season, if moisture reserves are low, when to cut a crop for hay rather than harvest for grain.
To access the soil moisture portal, you need to start a free account using this link:
The portal can be accessed on your computer or smart phone. Once your account is set up, head to the resources tab. Here you’ll find a few quick video tutorials that will help familiarise you with the portal. The resources tab also hosts some useful factsheets, case studies and webinars.
Below are some recent screenshots taken from the portal, highlighting some of the data you’re able to access.

The site map feature shows the location of each weather station. There are over 70 weatther stations and soil moisture probes across the network. You can use the site map to discover which stations are closest to you.

Air temperatures from across the network using the ‘Live Map’ feature. The live map can also be used to track a range of measurements such as rain, soil moisture, wind speed and Delta T.

Use the dashboard feature to navigate to individual weather stations.
Here’s some of the data displayed for the Lah soil moisture probe.
The first graph is a summary of soil moisture for the upper soil profile (top 70cm) and the lower soil profile (80-120cm) and a combined summary displayed in blue. Rainfall is also displayed. This graph indicates the soil moisture increased at the start of winter, and drew down as expected during the growing season.
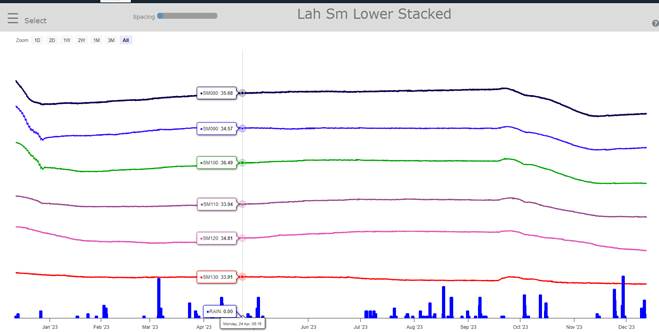
A closer look at the soil moisture sensors at depth shows a small increase in soil moisture in September, followed by a small decrease as the crop has accessed soil moisture at depth.

The dashboard can also be used to view weather data. Here’s the Dela T graph for the Minyip weather station over the last week. The yellow zone is the preferred condition for spray efficiency.

Another handy feature is the rainfall table. From this display, you can choose to view monthly and annual rainfall tallies, or drill down view rainfall within a chosen month.